Carbon Reporting
Dalton aims to provide transparency across its investment portfolios in terms of its carbon footprint. The data below is reflective of the all the equity positions held at Dalton investments that are covered under the firm’s sustainability policy. For comparison purposes we have referenced the holdings of Dalton Investments against the MSCI Asia Pacific Index. The MSCI Asia Pacific Index is a broad index that is reflective of Dalton’s wider investable universe. The table below provides Scope 1, 2, and 3 emissions for all those companies where data is available and reported.
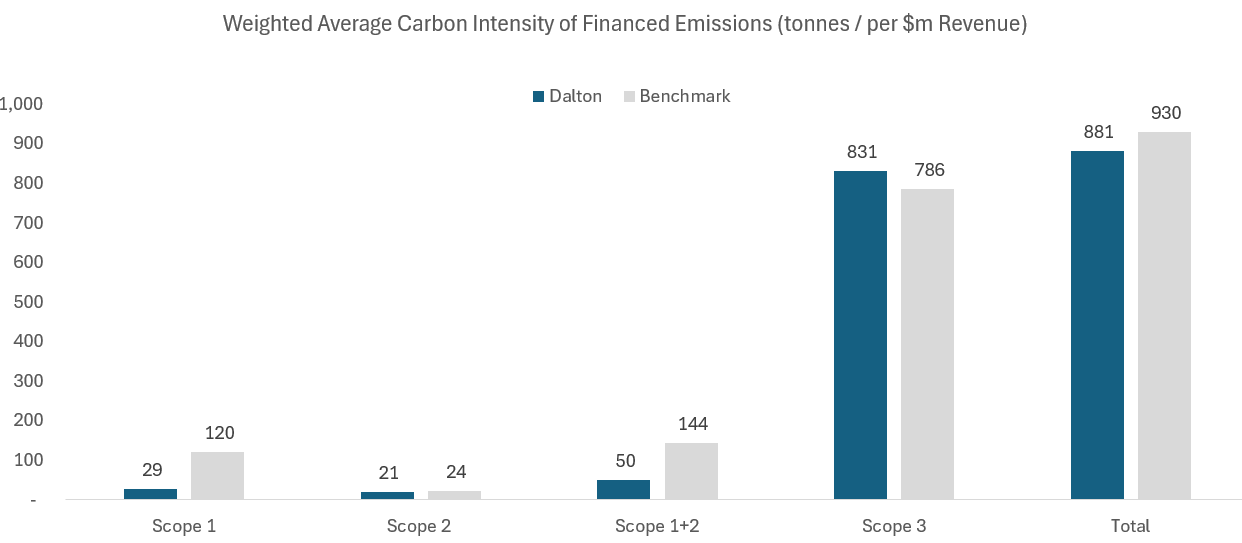
Financed Emissions
| DALTON INVESTMENTS | BENCHMARK | |||
|---|---|---|---|---|
| Tonnes | Coverage (% NAV) | Tonnes | Coverage (% NAV) | |
| Total Scope 1 | 155,359,945 | 93% | 5,539,158,179 | 95% |
| Total Scope 2 | 86,964,857 | 92% | 906,321,073 | 95% |
| Total Scope 3 | 2,379,294,096 | 93% | 28,394,456,229 | 95% |
Data as at 30 June 2025, and MSCI Asia Pacific is the reference benchmark.
⁺Emissions data is calculated using the methodology outlined by the Partnership for Carbon Accounting Financials (PCAF). This methodology applies an attribution factor to the total emissions of each equity investment in the firm. The attribution factor is the outstanding amount of listed equities plus debt divided by the enterprise value, including cash. The total emissions produced by the company (using Refinitiv data) are then adjusted by this attribution factor for each company and summed for all the firm’s investments. The full PCAF methodology can be reviewed at https://carbonaccountingfinancials.com/ [carbonaccountingfinancials.com]. Weighted average emissions is calculated for the data reported as the sum of total financed emissions divided by $m of revenue multiplied by the weight for each company in the portfolio or respective reference index.